I recently made a simple tutorial using the fun dog protocol dataset from 19th Century Denmark, which I have been wanting to share.
This tutorial was originally for my talk at the University of Edinburgh Centre for Data, Culture & Society: Skills in Heritage Data Science: Meet the Dogs of 19th Century Denmark on the 13th of January 2021. A recording of the talk can be seen at the CDCS website.
You are welcome to try the tutorial in the Google Colab workbook or download it for later use. It is licensed with CC BY 4.0 and can be found here: https://colab.research.google.com/drive/1M6pM9orJzg9CuSPYVpmfFY6Svv_RgkHN?usp=sharing
The idea with this tutorial is to show how few steps are needed in Python to begin to visualise and understand a heritage dataset.
The background for this dataset is a registry of dog owners in 19th Century Kolding, Denmark. In 1824 Denmark rolled out a system of dog tags for citizens in towns – if a dog wasn’t wearing one it might be put down due to the fear of rabies.
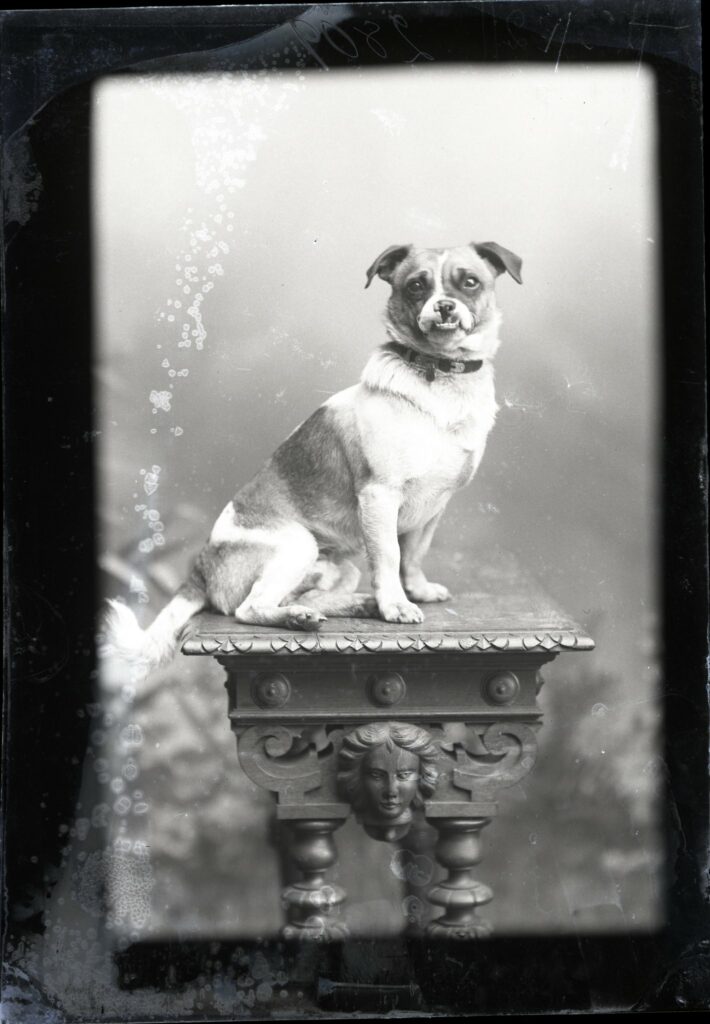
Handskemager Meyers hund.
by Hoffgaard 1895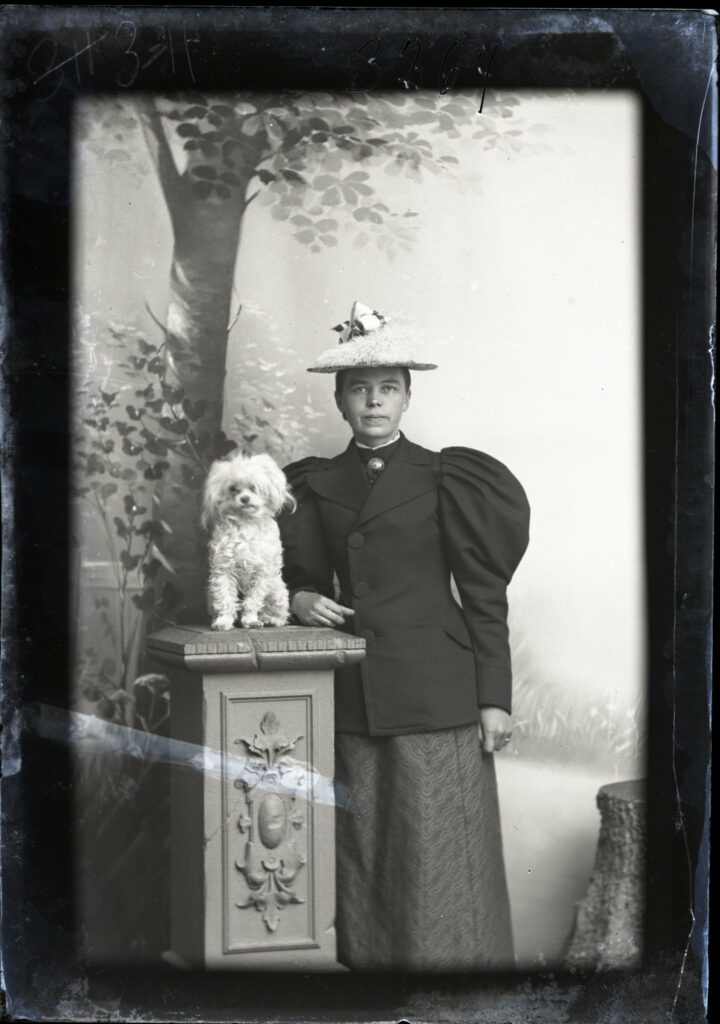
Eraka Petersen og hund.
by Hoffgaard 1895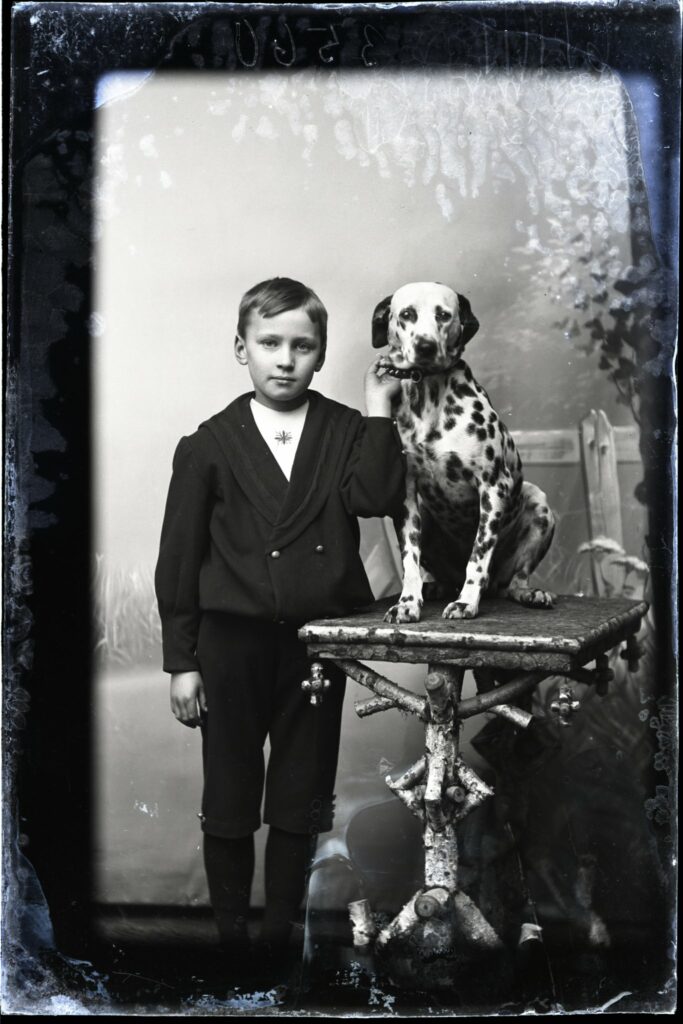
Slagteridirektør Christensens søn og hund.
by Hoffgaard 1896.
Of course somebody had to be in charge of handing out dog tags and taking payment (1 rigsdaler) and this transaction had to be registered in a protocol. The police in various towns made these registries, however the types of information they put down differs from place to place and time to time. Actually, it probably mostly differs from person to person. Apart from the name of the owner and whether they had paid that year, some also registered the name of the dog, it’s breed (hunderace), colour (farve), sex (køn), age (alder) and other features of the dogs. But this was done in a rather random way.
The protocols dataset contains 1232 rows of data which have been transcribed as a part of a project with my 2019 class on Digital Heritage at the University of Copenhagen. The protocols begin in 1824 and end in 1874. The students were responsible for a few pages from the protocols and had help from volunteer community historians on Facebook. In class we used the protocols as a case to explore the creation, organisation, and communication of heritage datasets. Based on the dataset we made an Entity Relationship Diagram and the structure of a Relational Database in MySQL as well as both low and higher fidelity prototypes of a website to communicate the dataset to specific usergroups.
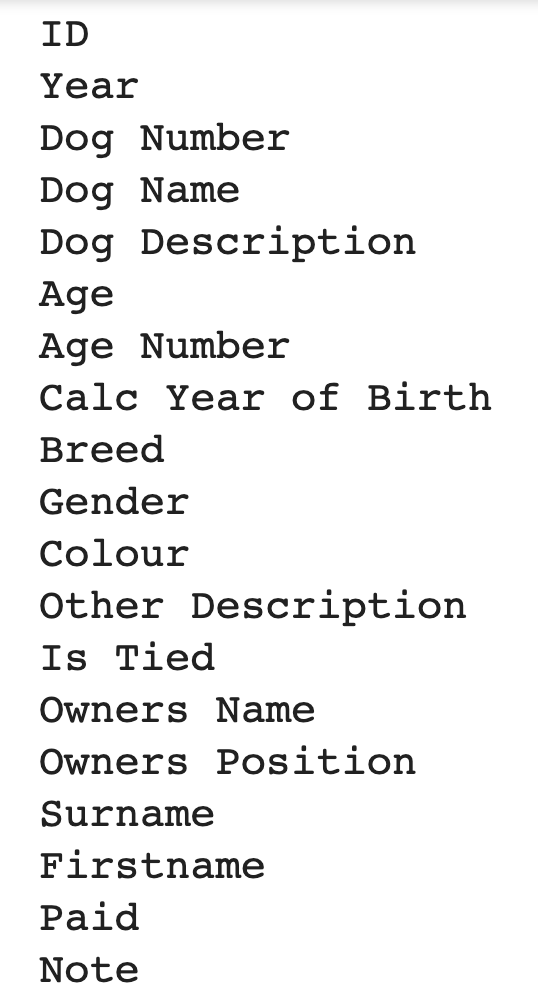
The dataset in its raw dataform can be found on Github as a CSV file with 1232 rows and 19 columns:
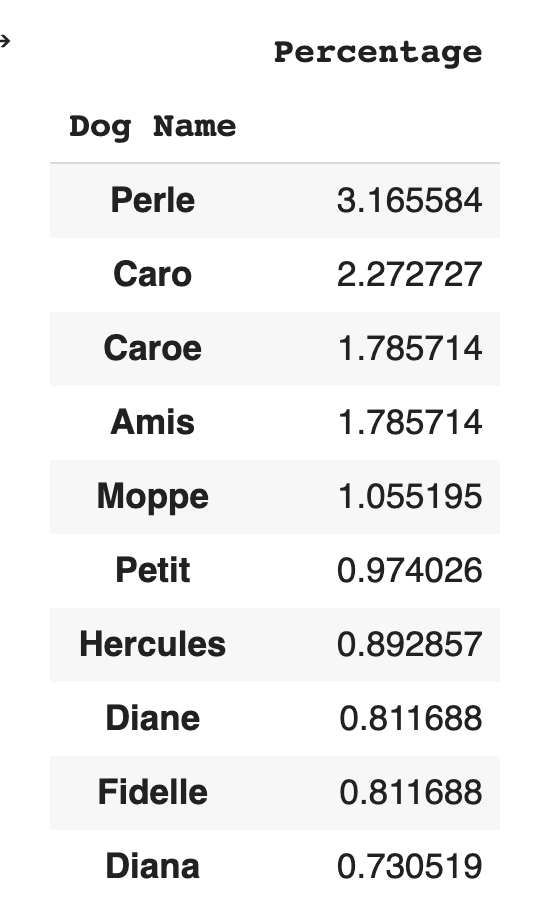
The tutorial shows three ways of visualising some of the dataset. The first calculates the dog names and presents the top 10 names. This shows that the most popular dog names in the dataset is “Perle” which means Pearl in Danish.
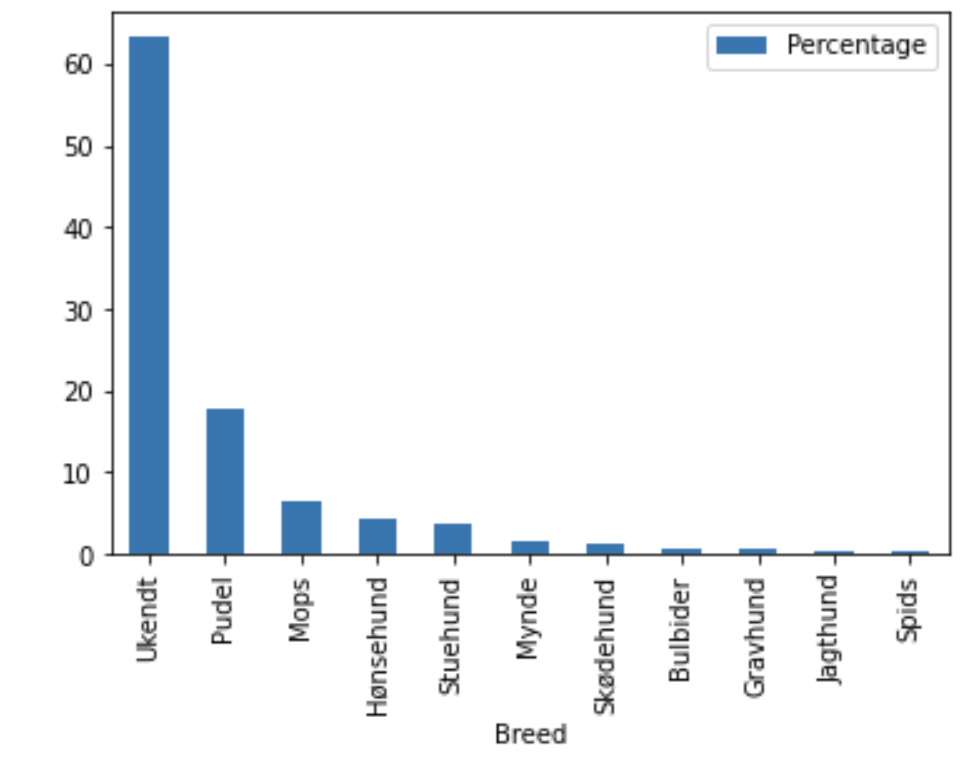
The second is a visualisation of the percentage of dog breeds in the dataset, showing how most dogs have an unknown breed (ukendt). The most popular known breed of dog is the Poodle (Pudel) at 17.6% and the second most popular known breed is a Pug (Mops) at 6.3%.
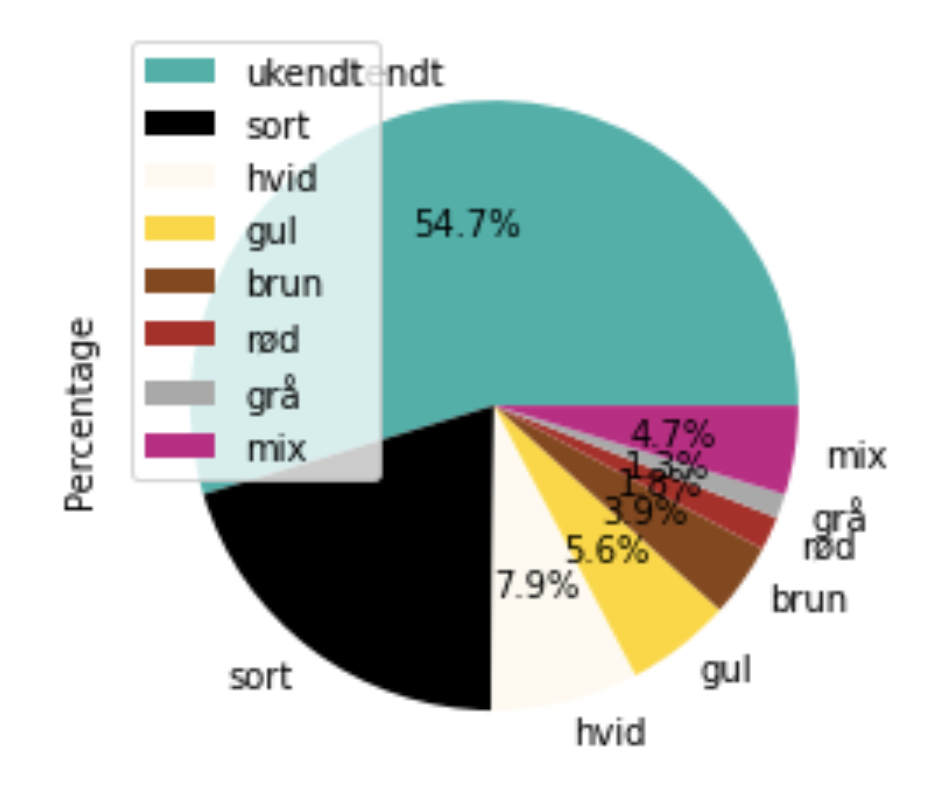
The last is a visualisation of the dog colours in a pie chart. Again most of the dogs are an unknown colour (teal) and nearly 5 % are a mix of colours (pink). The rest are displayed with the right colour in the diagram, black being the largest category at 20 %.
If you are interested in Open Heritage Data you can read more about my book in this post.
As always, I would love to hear what you think about this subject on Twitter, LinkedIn or via email.